
SQL Server 2005 and SQL Server 2008 provide graphical
reports for monitoring system health and performance. While there have always
been various queries, stored procedures, and of late, Dynamic Management Views,
to gather system statistics, none were graphical. These new reports provide a
quick easy way to print off a professional looking report for presentations or
discussions. This article will examine the built in reports called SQL Server
Management Studio Reports and an additional add-on called Performance
Dashboard.
The Management Studio Reports are SSRS (Server Server
Reporting Service) generated, but SSRS is not required to be installed. SQL
Server Service Pack 2 is not required for the built in reports on SQL Server
2005, but is required for the optional add-on Performance Dashboard. Once Service
Pack 2 is installed however, custom reports can be created and run like a built
in report. This article will assume Service Pack 2 is installed. The service
pack can be downloaded from Microsoft’s web site at the following URL: http://www.microsoft.com/downloads/details.aspx?familyid=d07219b2-1e23-49c8-8f0c-63fa18f26d3a&displaylang=en
. The built in reports are included with the install on SQL Server 2008.
To run a report, right click a database and select Reports: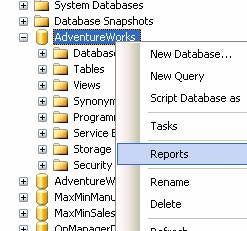
Then select Stand Reports. A list of seventeen built in
reports will be displayed. These include:
Let’s take a look at a report; run the Disk Usage report
displayed below: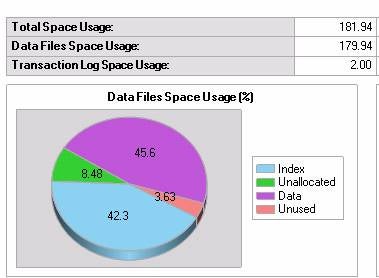
This report provides a quick professional looking graphical
view of disk usage. As a side note, reports like these can be generated for a web
page in Visual Studio also without SSRS being installed. Use the ReportViewer
control in “local mode”.
The Disk Usage by Top Tales provides a quick report of table
record counts and disk usage as shown below.
SQL Server Profiler can be used to capture the underlying
TSQL used by these graphical reports. Often the code is complex but can provide
some interesting insight into the Dynamic Management views and procedures
used. To start Profiler on SQL 2005, go to Start, Programs, Microsoft SQL
Server 2005, Performance Tools, and then select SQL Server Profiler. Once
opened, select File, New Trace, connect to your server, and then select “TSQL”
from the “Use the template” drop down list. Click Run. Now return to the SQL
Server Management Console and run a report. Profiler will populate with the
TSQL executed as shown below.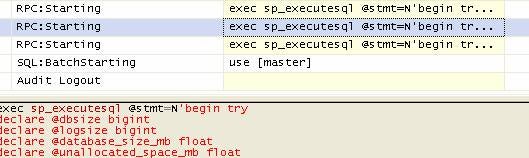
In addition to the standard built in reports, custom reports
can also be run from the SQL Server Management Studio. A free family of custom
reports available from Microsoft is the Performance Dashboard for SQL Server
2005. The Dashboard is a set of reports used to monitor performance and help
diagnose performance problems. For example, the Performance Dashboard can help
resolve CPU bottlenecks, IO bottlenecks, and Blocking problems. It can be
downloaded from the following Microsoft web site: http://www.microsoft.com/downloads/details.aspx?familyid=1d3a4a0d-7e0c-4730-8204-e419218c1efc&displaylang=en
. Service Pack 2 for SQL Server 2005 is required prior to the Performance
Dashboard being used.
Once the Dashboard is downloaded, run the MSI to begin
installation. Note the file installation path, such as C:Program
FilesMicrosoft SQL Server90ToolsPerformanceDashboard . Once complete, run
the “setup.sql” file inside the SQL Server Management Studio. This setup file
needs to be run on each SQL Server you wish to monitor using the Dashboard. In
the same directory is a help file called PerfDash.chm. Inside the help file is
a section worth reading called Troubleshooting Methodology.
To run the dashboard once installation is complete, right
click a database and select Reports, Custom Reports. Browse to your
installation folder then select performance dashboard main.rdl. The other
reports in the folder are called from this main.rdl (Report Definition
Language). If you try to run one directly, like traces.rdl, some type of error
will be thrown. The main.rdl is shown below. From this screen, you can drill
into IO, Waits and session information.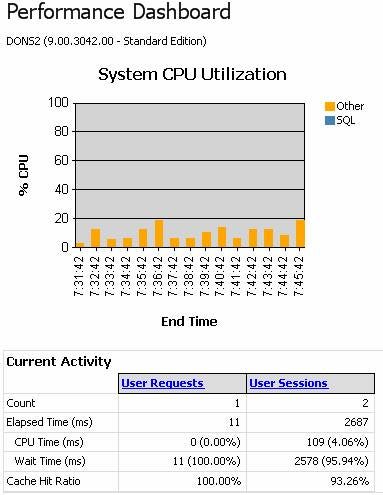
The Performance Dashboard is an example of a custom
report. In addition to the custom reports available from Microsoft, you can
create your own custom reports by using BIDS (Business Intelligence Development
Studio). BIDS is included with SQL Server. To create a custom report, we’ll
generate a RDL (report definition language) file from BIDS, and then execute it
from the SQL Server Management Studio.
To begin, select Start, Programs, Microsoft SQL Server 2005,
and then click SQL Server Business Intelligence Development Studio. From the
top menu, select File, New, and then Project. The Project Type should be
“Business Intelligence Projects” and the template should be Report Server
Project Wizard. Enter a name and location and then click OK. Click “Next” on
the splash screen. Create a new data source as shown below by clicking the
Edit button and specifying your server name and database. This example will
use Adventure Works.
Click “Next” and enter “SELECT * FROM Person.Contact” as the
query sting, then click “Next” again. Leave the default of Tabular and click
Finish. Supply a report name and click “Finish” again. Close BIDS. From SQL
Server Management Studio, right click Adventure Works and select Reports,
Custom, then browse to your newly created report. If the display formatting of
the report is not good, reopen the report in BIDS and adjust.
SQL Server 2005 and SQL Server 2008 offer reports for quick
and easy monitoring and troubleshooting. In addition, user created “custom”
reports can be saved and executed in SQL Server Management Studio. The free
Performance Dashboard can be very helpful in bottleneck troubleshooting. Included
with the Performance Dashboard is a help file, which explains which reports to
use for diagnosing various problems.
»
See All Articles by Columnist Don Schlichting
Subscribe to Cloud Insider for top news, trends & analysis
DatabaseJournal.com publishes relevant, up-to-date and pragmatic articles on the use of database hardware and management tools and serves as a forum for professional knowledge about proprietary, open source and cloud-based databases–foundational technology for all IT systems. We publish insightful articles about new products, best practices and trends; readers help each other out on various database questions and problems. Database management systems (DBMS) and database security processes are also key areas of focus at DatabaseJournal.com.
Advertise with TechnologyAdvice on Database Journal and our other IT-focused platforms.
Property of TechnologyAdvice.
© 2022 TechnologyAdvice. All Rights Reserved
Advertiser Disclosure: Some of the products that appear on this site are from companies from which TechnologyAdvice receives compensation. This compensation may impact how and where products appear on this site including, for example, the order in which they appear. TechnologyAdvice does not include all companies or all types of products available in the marketplace.