In my last article (SQL Server 2008 Data Collections and the Management Data Warehouse) I discussed the new Data Collection feature and the Management Data Warehouse (MDW) that were introduced with SQL Server 2008. With this new feature came three system Data Collection sets. These data collections gather and store statistics into the MDW. In this article, I will discuss and show you the different data collection standard reports that have been provided to display information related to the statistics collected by the system data collections.
For those of you that didn’t read my first article, the MDW is a database that contains the statistics that are gathered by data collections. SQL Server 2008 provides three system data collections: Disk Usage, Query Statistics, and Server Activity. These data collections run routinely and add statistics to the MDW. It is these statistics that are used by the standard reports to provide DBAs with trend and performance information for a SQL Server instance.
Microsoft has provided three different standard reports. These reports are in line with the three system data collections, and here are their names: “Server Activity History”, “Disk Usage Summary”, and “Query Activity History”. These are Reporting Services reports and are rendered within SQL Server Management Studio (SSMS). To bring up any one of these reports, expand the “Management” item in the SSMS Object Explorer pane and then right click on the “Data Collection” item. Then in the drop down menu hover your mouse over the “Report” item. This will bring up an additional menu. On this menu, mouse over the “Management Data Warehouse” item. Doing this will bring up a menu that looks something like this (menu on the far right):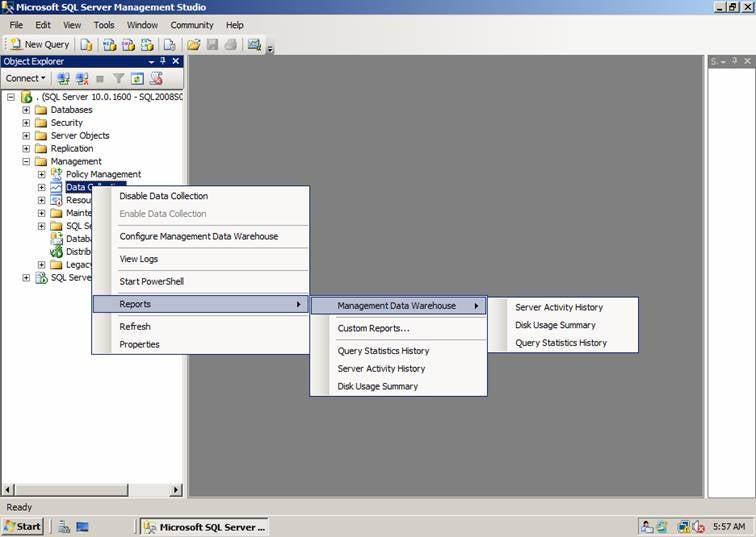
Here you can see the three different reports to select from. Let’s take a closer look at each one of these reports.
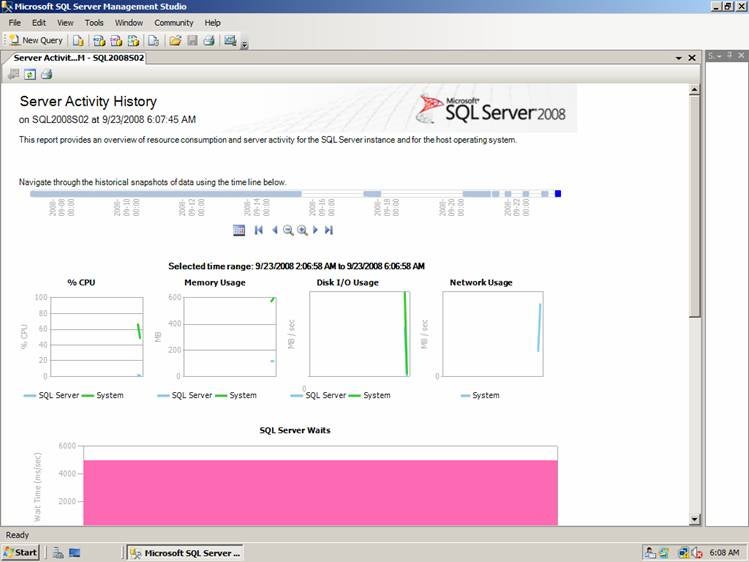
This report displays information collected by the “Server Activity” system Data Collection. A number of different dynamic management views and System Monitor performance counters are used to collect statistics by this Data Collection. Therefore, this report allows you to get a good picture of how well your server and database instance is performing. This reporting displays a number of graphs: % CPU, Memory Usage, Disk I/O Usage, Network Usage, SQL Server Waits, and SQL Server Activity. Each of these graphs has drill down capabilities so you can get a more detailed picture of activity associated with a particular resource. When you first bring up a report, it will look something similar to this:
The selected time frame for the graph is determined based on the current time frame for when you render the report. If you want to select a different time frame, you need to use the navigational bar at the top of the report. You have a number of different choices for how to identify the time frame you want to display. One method is to place your mouse on any part of the light blue bars in the time line, and then click. Doing this will display a graph for that time frame. You can also use the calendar icon to identify a more specific time frame in which to display information. You can also use the triangle symbols to move backwards and forward in the timeline. The magnifying glass icons can be used to change the duration of time for which statistics are displayed, you have 5 different durations to pick from: 15 minutes, 1 hours, 4 hours, 12 hours, or 24 hours. By clicking on the plus (+) magnifying graph you can shorten the display time frame; by using the minus (-) magnifying graph you can lengthen the display time frame.
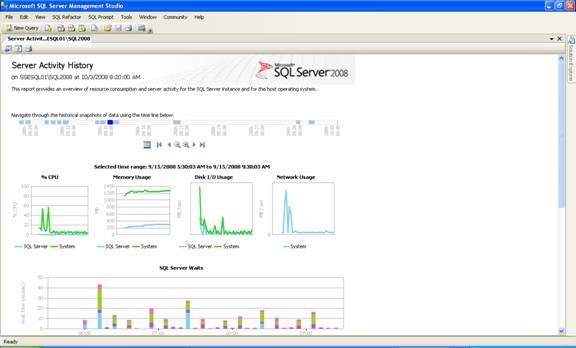
The default time frame of the graph above doesn’t really show a very interesting picture of activity since there was very little activity during that time frame. Here is a time frame that shows a little more interesting set of graphs:
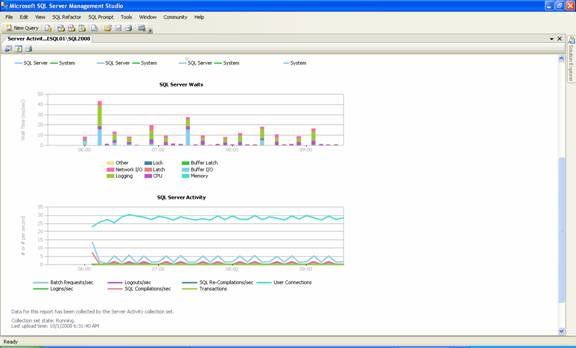
Here you can see there is more activity going on during the time frame being displayed. This report has more than one screen worth of information. To see the additional information you need to scroll down with the scroll bar on the right. There is one more graph that can be displayed by scrolling down. Here is what is displayed when I scroll down on my machine:
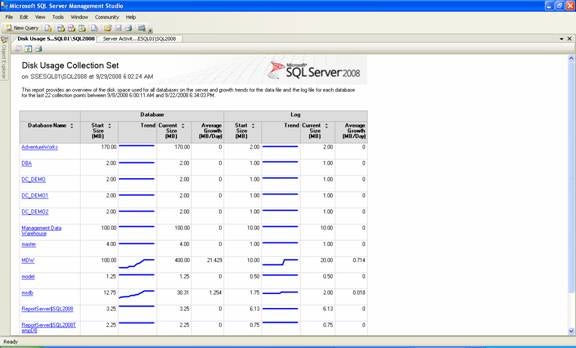
The Disk Usage report allows you to track the disk consumption trends of your databases. This report graphically shows your disk consumption for both DATA and Transaction Log usage for each database over time. Below is a sample of this report from one of my database instances:
This report is useful for showing how fast, or slow each one of your databases is growing. This information can be used to help the DBA perform capacity planning for their database environment.
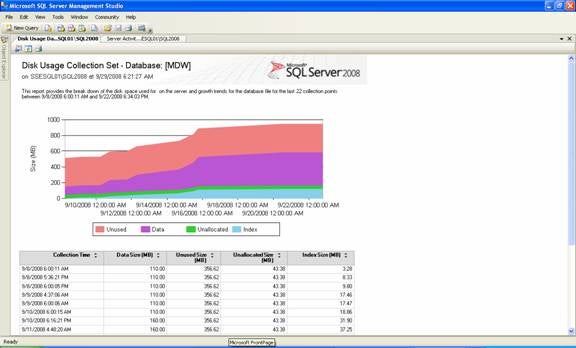
You can drill down into each of the databases to get a more detailed report. This is done by hovering your mouse over one of the graphs or the name of a database, and then left clicking on your mouse. If you are on the name of the database then you will get a standard Disk Usage report. If you are hovering over either the Data or Log graph then you will get a more detailed display of the space allocated for that component. Here is the report that is displayed when I hover over the MDW Data graph and click:
In this drill down report, you can see the growth rate of each component (Unused, Data, Unallocated and Index) for my MDW database Data file. You also are given the tabular data associate with the graph. With this graph, you able to determine the distribution of disk space between data and indexes, unused and unallocated space.
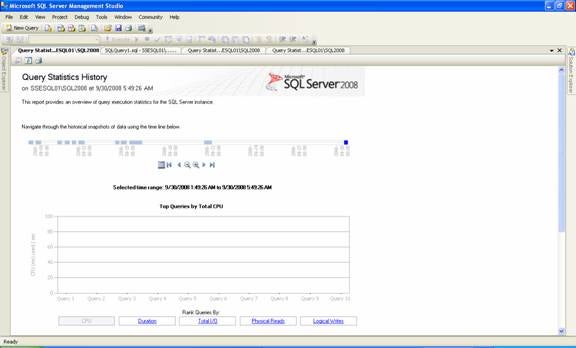
The Query Statistics History report provides a report on information captured by the Query Statistics data collection. With this report, you can identify the worse performing T-SQL statements by CPU, Memory, Total I/O, Physical Read, and Logical Writes. When you bring up this report, you should see a report similar to the following:
As you can see this report has a navigational bar at the top similar to the Server Activity History report. This report identifies the top 10 queries by CPU. Since my instance has no applications running against it, and the only resources used on this instance are those consumed by the data collection activities, there are no commands that have been executed that use a significant amount of CPU. Because of this, it appears that no queries have been identified. If I were running applications that had commands that used a significant amount of CPU then you would see some bars in the “Top Queries by Total CPU” on this graph. This report is a multi-page report. By scrolling down you are able to see the top 10 commands by CPU, even though they didn’t use a significant amount of CPU to even make a blip on the graph. Here are the top 10 commands by CPU on my machine when I scroll down:
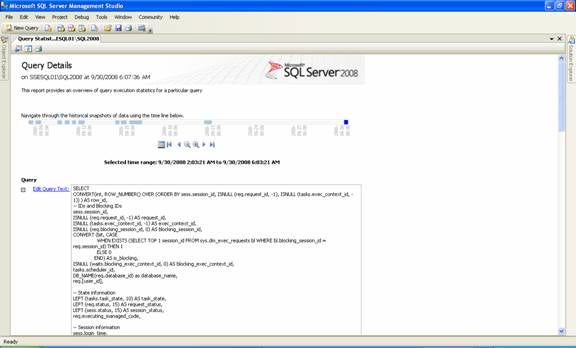
You can see the top 10 commands by duration by clicking on the “Duration” hyperlink, or you can click on the “Total I/O”, “Physical Reads”, and/or “Logical Writes” to look at the top 10 commands for those items. You can get the complete text of the identified queries by clicking on the query text hyperlinks. When I click on the 1st query hyperlink above, the following page is displayed:
Here I am able to see the complete text of the query by scrolling up and down on this report. On this report, there is a drill down link named “Edit Query Text”. This hyperlink allows you to get the text of the query into the query editor. This is a very useful link if you want to play with the identified query to see if you can optimize it.
If you scroll down to the bottom of this report, you can drill down and look at the query plan for this statement. From the drill down report, you can drill down further and display the actual execution plan that was used.
As you can see, the Query Activity History report allows you to look at a number of different statistics associated with resources that queries are consuming on your instances. Keep in mind the Query Activity data collection doesn’t capture every query run on your instance, but only those that meet a particular criteria. Review Books Online to identify all the different criteria for which T-SQL statements are captured by the Query Activity data collection.
With the introduction of the data collection feature in SQL Server 2008, it makes it easy for the DBA to build a collection and reporting method to monitor SQL Server. The “Disk Usage Summary” report gives the DBA the reports they need to monitor disk space consumption for capacity planning, the “Server Activity History” helps identify bottlenecks of critical resource and the “Query Statistics History” report can be used to identify T-SQL statements that exceed some particular threshold levels. The system data collection and reporting capabilities in SQL Server 2008 is an excellent performance monitoring feature and I’m sure Microsoft will continue to expand this feature with each new release of SQL Server.
» See All Articles by Columnist Gregory A. Larsen
Subscribe to Cloud Insider for top news, trends & analysis
DatabaseJournal.com publishes relevant, up-to-date and pragmatic articles on the use of database hardware and management tools and serves as a forum for professional knowledge about proprietary, open source and cloud-based databases–foundational technology for all IT systems. We publish insightful articles about new products, best practices and trends; readers help each other out on various database questions and problems. Database management systems (DBMS) and database security processes are also key areas of focus at DatabaseJournal.com.
Advertise with TechnologyAdvice on Database Journal and our other IT-focused platforms.
Property of TechnologyAdvice.
© 2022 TechnologyAdvice. All Rights Reserved
Advertiser Disclosure: Some of the products that appear on this site are from companies from which TechnologyAdvice receives compensation. This compensation may impact how and where products appear on this site including, for example, the order in which they appear. TechnologyAdvice does not include all companies or all types of products available in the marketplace.

