Azure DevOps suffered several outages earlier this month. Microsoft has done a root cause analysis to find the causes. This is after Azure cloud was affected by the environment last month.
It started on October 3 with a networking issue in the North Central US region lasting over an hour. It happened again the following day which lasted an hour. On following up with the Azure networking team, it was found that there were no networking issues when the outages happened. Another incident happened on October 8.
They realized that something was fundamentally wrong which is when an analysis on telemetry was done. The issue was not found after this. After the third incident, it was found that the thread count on the machine continued to rise. This was an indication that some activity was going on even with no load coming to the machine. It was found that all 1202 threads had the same call stack, the following being the key call.
Server.DistributedTaskResourceService.SetAgentOnline
Agent machines send a heartbeat signal every minute to the service to notify being online. On no signal from an agent over a minute it is marked offline and the agent needs to reconnect to signal. The agent machines were marked offline in this case and eventually, they succeeded after retries. On success, the agent was stored in an in-memory list. Potentially thousands of agents were reconnecting at a time.
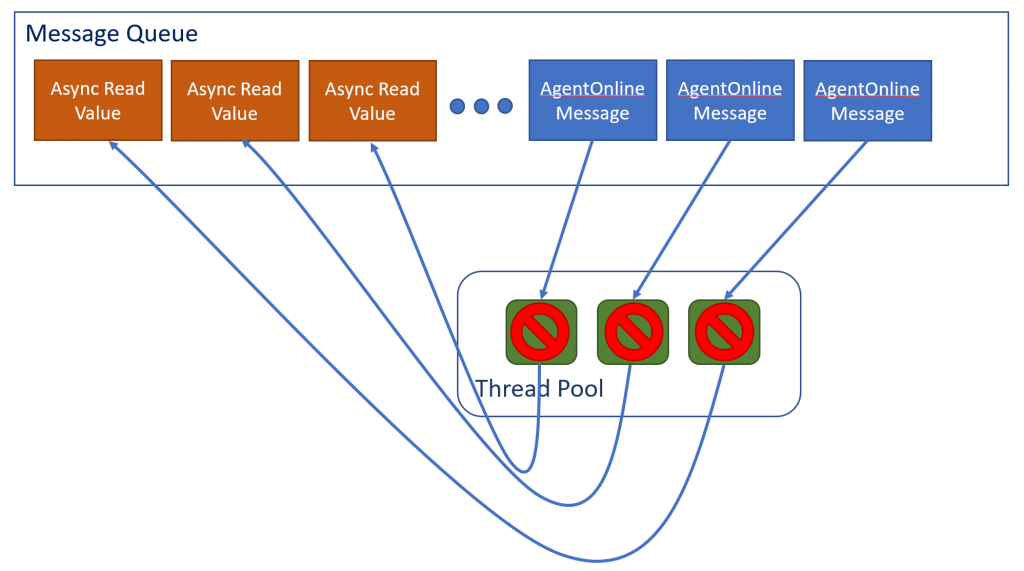
In addition, there was a cause for threads to get full with messages since asynchronous call patterns were adopted recently. The .NET message queue stores a queue of messages to process and maintains a thread pool where. As a thread becomes available, it will service the next message in queue.
Source: Microsoft
The thread pool, in this case, was smaller than the queue. For N threads, N messages are processed simultaneously. When an async call is made, the same message queue is used and it queues up a new message to complete the async call in order to read the value.
This call is at the end of the queue while all the threads are occupied processing other messages. Hence, the call will not complete until the other previous messages have completed, tying up one thread.
The process comes to a standstill when N messages are processed where N also equals to the number of threads. At this state, an device can no longer process requests causing the load balancer to take it out of rotation. Hence the outage.
An immediate fix was to conditionalize this code so no more async calls were made. This was done as the pool providers feature isn’t in effect yet.
On October 10, an incident with a 15-minute impact took place. The initial problem was the result of a spike in slow response times from SPS. It was ultimately caused by problems in one of the databases. A Team Foundation Server (TFS) put pressure on SPS, their authentication service.
On deploying TFS, sets of scale units called deployment rings are also deployed. When the deployment for a scale unit completes, it puts extra pressure on SPS. There are built-in delays between scale units to accommodate the extra load. There is also sharding going on in SPS to break it into multiple scale units.
These factors together caused a trip in the circuit breakers, in the database. This led to slow response times and failed calls. This was mitigated by manually recycling the unhealthy scale units.
For more details and complete analysis, visit the Microsoft website.
Real clouds take out Microsoft’s Azure Cloud; users, developers suffer indefinite Azure outage
Why did last week’s Azure cloud outage happen? Here’s Microsoft’s Root Cause Analysis Summary.
Is your Enterprise Measuring the Right DevOps Metrics?
Monthly digest of what’s new and exciting from us.
© 2023 Company, Inc. All rights reserved.
Cookie Policy and Privacy Policy
