The ability to add structure to Visio diagrams using containers, lists, and callouts was introduced in Visio 2010 and has remained a key feature of every version of Visio since. In this article I’ll describe a mashup of containers and lists that meet a real-world need.
Prior to reading this article, it would help to read my previous articles on containers and lists.
My goal is to create a seating chart for an auditorium or theater. I would like the diagram to be sufficiently flexible that I can move seats and rows around to reconfigure the auditorium or to represent a different theater. But more than that, when I move seats and rows, I want Visio to do all of the work of numbering and renumbering the seats and rows.
Prior to Visio 2010, it would have required writing a program to number and renumber something as complex as the collection of seats and rows in a theater. However, with all recent versions of Visio, we can build a complete solution using three elements: containers and lists, shape data, and a handful of ShapeSheet formulas.
The key to building our solution is to remember that a list is a special type of container that maintains its members in a specific sequence. This property is the perfect basis for creating numbered rows and seats in a theater. Consequently, it seems that all we should need to do is to create two lists:
Unfortunately, it’s not quite that simple because a Visio list cannot contain another list. It can contain shapes and containers, but it cannot contain other lists. Therefore, to create our seating solution we need a workaround.
The workaround comes in the form of a container. While lists can’t contain other lists, it turns out that containers can contain anything. Consequently, we will package each seat list in a container. Then we can drop multiple copies of this container into the list representing a section of the theater. In effect, we put a list inside a container inside a list.
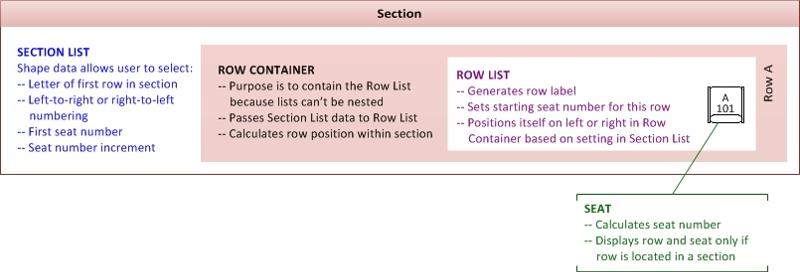
The resulting structure is summarized in the following graphic. The figure below shows the Visio building blocks:
Shape data is a critical part of fulfilling my goal of completely automatic numbering. Shape data fields on the theater section lists allow me to set different numbering and lettering options for different parts of the theater. The shape data dialog below shows that I can customize:
Each of the four shape types shown in the first illustration above contains several formulas. Most of the formulas read values from the section list’s shape data fields and pass it to contained shapes. In some cases, the formulas transform the data. For example, the row container includes formulas that convert an ordinal position in the section list to a row letter, e.g., converting “3” to “C”.
Two of the four shapes – the row container and the seat – contain formulas that calculate their position within their respective lists.
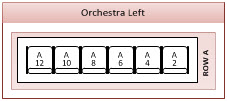
The seat shape also contains formulas that determine whether the seat is currently in a row and whether the row is in a section. If both conditions are true, the seat displays its seat number and the letter of the containing row as shown below. If both conditions are not true, the seat displays nothing, as illustrated by the single seat in the image earlier in this article.

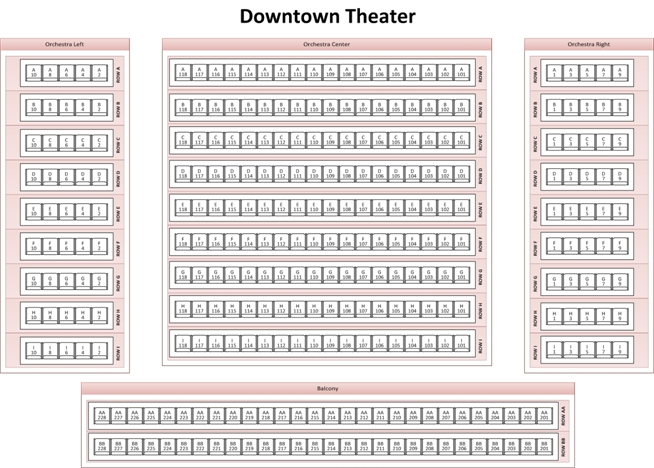
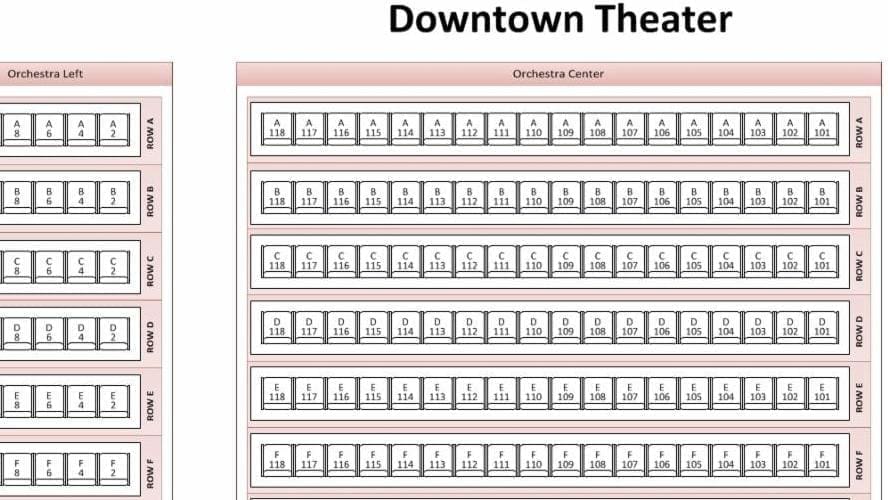
The figure below employs the list-container-list-seat structure for a hypothetical theater. This example takes full advantage of the shape data contained in each section to show the following variations: The best part of this example is that we’ve met our goal: all of the row lettering and seat numbering is handled automatically – there is no programming required. If you add or delete a row or a seat, everything around it will resequence automatically. In the graphic on the left below, for example, a new row is being dropped into the Orchestra Left section between two existing rows. (Note the orange feedback lines that are characteristic of a Visio list.) The result is shown on the right below.

If you would like to experiment with the list and container mashup described in this article, you can download a Visio diagram containing the theater seating chart example. The first page contains more detailed instructions for using the various shapes.
The theater seating chart demonstrates that Visio lists enable complex, dynamic numbering without requiring any programming. I hope these examples stimulate your imagination about ways that you might use lists and containers.
If you have questions or want to describe great uses you’ve invented for structured diagrams in Visio, please post them below.
For more information about containers, lists and callouts in Visio, refer to Chapter 11 in Visio 2010 Step by Step or Visio 2013 Step by Step, or Chapter 13 in Visio 2016 Step by Step. All three books are available from my website or wherever you buy books.
You will also find container details in several articles on the truly excellent Visio Insights blog written by the Visio development team:
=-=-=-=-=-=-=-=-=-=-=-=-=-=-=-=-=-=-=-=-=-=-=-=-=-=-=-=-=-=-=-=-=-=-=-=-=-=-=-=-=
If you liked this article and want to see more from this author, please click here.
If you found this article helpful, please click the Yes button near “Was this article helpful?” below.
To learn more about Visio 2010, please visit the Visio Step by Step web site.
=-=-=-=-=-=-=-=-=-=-=-=-=-=-=-=-=-=-=-=-=-=-=-=-=-=-=-=-=-=-=-=-=-=-=-=-=-=-=-=-=
Have a question about something in this article? You can receive help directly from the article author. Sign up for a free trial to get started.
The Original Tech Community


Leave a Reply