Call Quality Dashboard (CQD) is an online reporting tool that provides insight into the quality of calls made using Microsoft Teams. It is available at https://cqd.teams.microsoft.com.
Its functionality has come on leaps and bounds since the initial release, recently adding Near Real-Time (sessions appear in CQD in under 30 minutes), Personally Identifiable Information for 30 days (users full IP address, MAC address, BSSID, user IDs) and may more reports.
It has a number of built-in reports and detailed reports you can customise and more recently added some Power BI embedded reports (embedded meaning they use Power BI to render but within the CQD app).
You can find more about CQD in the official documentation here.
Now Microsoft has released 6 Power BI reports you can load into PowerBI.com and connect to CQD to directly populate data. Note the reports directly query CQD as you use them, so may take some time to load.
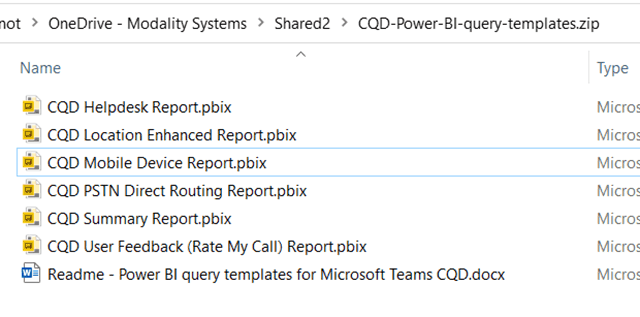
Microsoft has provided some specific Power BI report templates to download here.
The reports are:
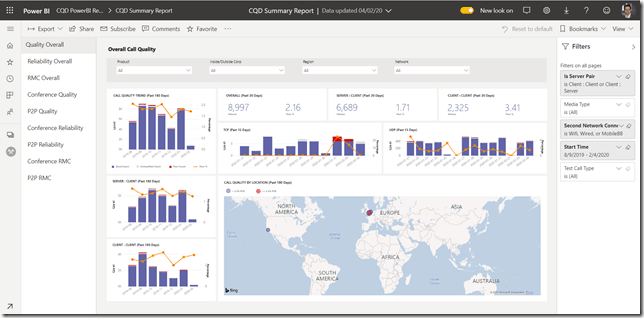
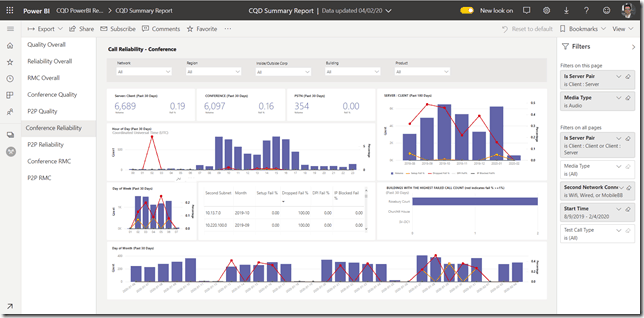
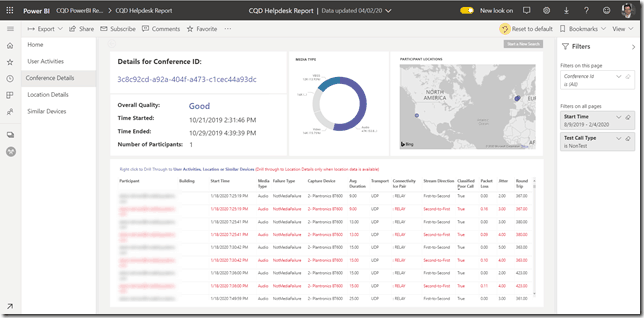
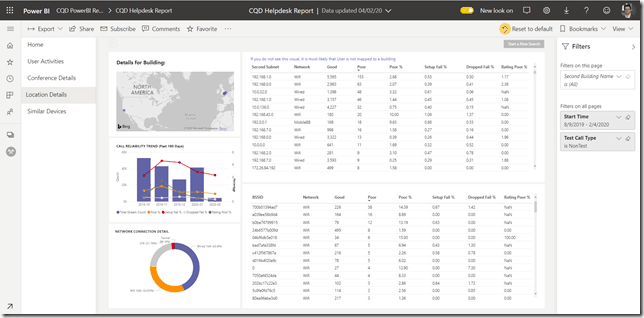
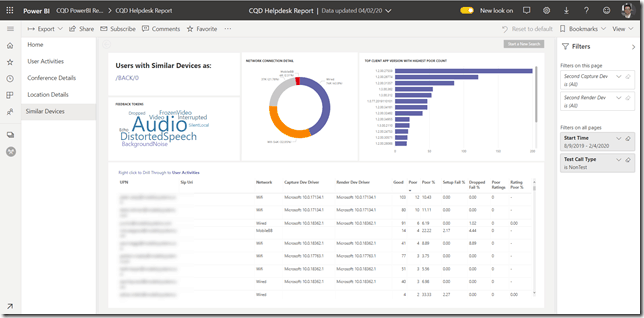
Better visualizations, improved presentation, increased information density, and rolling dates. These reports make it easier to identifier outliers. Drill into call quality by location with an easy-to-use interactive map.
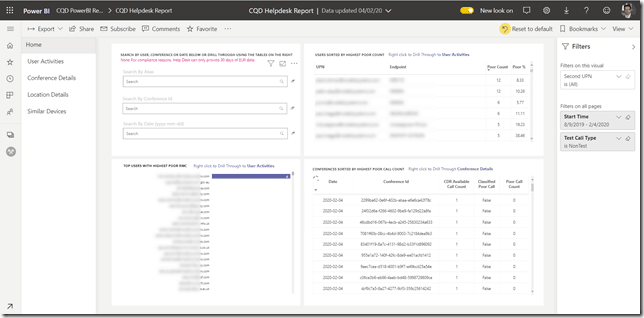
Integrating building and EUII data, this report is designed to let you drill up from a single user to find the upstream root cause of poor call quality for that user (for example, the user is in a building that’s experiencing network problems).
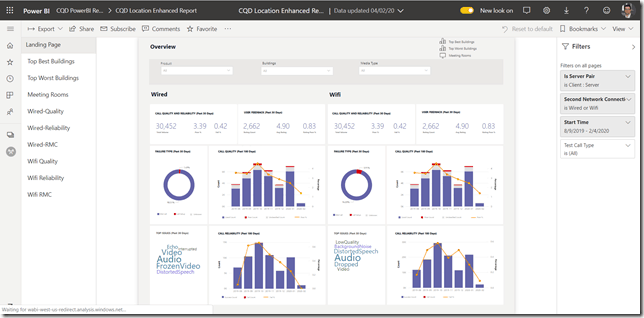
Re-imagining CQD SPD location reports. Includes 9 reports, providing Call Quality, Building WiFi, Reliability, and Rate My Call (RMC) information with additional drill-throughs by Building or by User.
Provides insights specifically tuned towards mobile device users, including Call Quality, Reliability, and Rate My Call. View mobile network, WiFi network, and mobile operating system reports (Android, iOS).
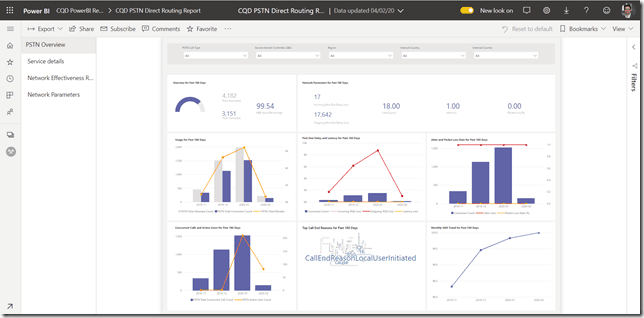
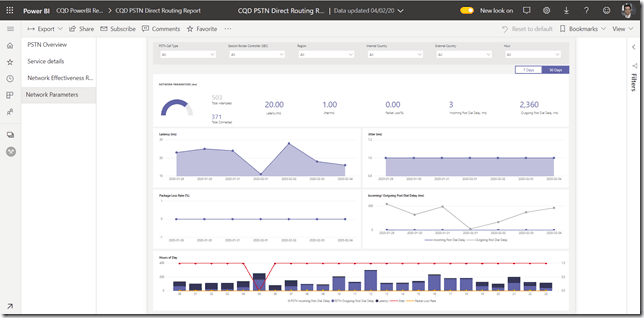
Provides insights specific for PSTN calls that go through Direct Routing.
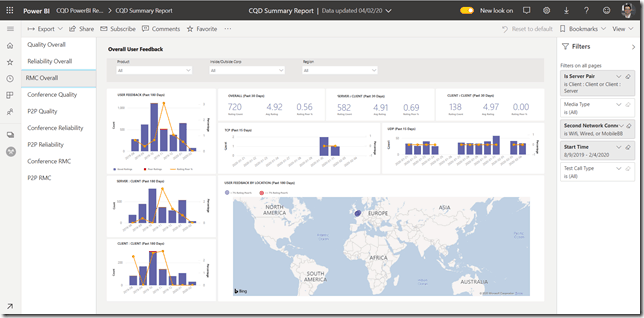
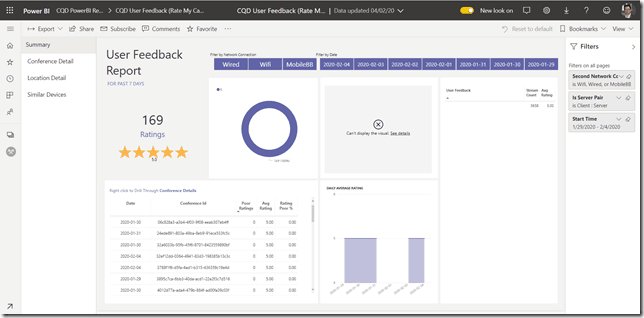
Shows Rate My Call data in a way that you can easily use to help support calling for your organization.
Thanks to my college and Power BI expert Rush Nour for helping me with these steps.
You will need access to PowerBI.com and a user account that already has access to CQD (https://cqd.teams.microsoft.com)
1) Download the PBIX reports pack here.
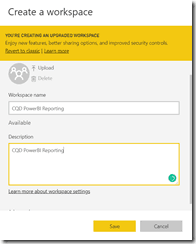
2) Go to PowerBI.com and create a workspace
Workspace/Create Workspace
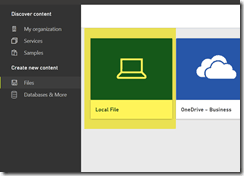
3) In the workspace welcome screen to Create New Content / Files / Get
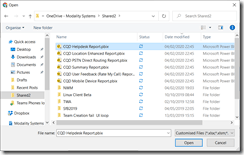
4) Upload the first PBIX file (you have to do one at a time, it doesn’t matter which you do first)
The report might just refresh but more likely you will need to specifically enter your credentials in step 5
5) Add your account credentials to connect to CQD and load the data
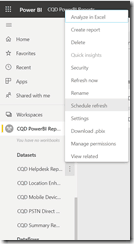
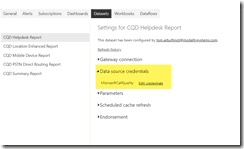
On the right expand the workspace and click the three dots next to data set for the PBIX then Scheduled Refresh
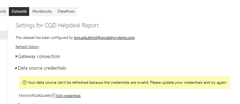
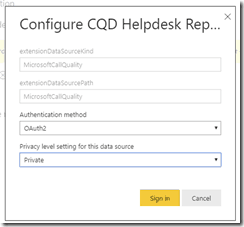
Under Datasets / Data source credentials click edit credentials
choose private and sign in with your account that can access CQD
The reports should now load data correctly.
6) Add the remaining report files
From here, to add the rest of the reports to the same workspace, in the workspace choose create / data set
And again upload the file
You can load all 6 reports into a single workspace and should only need to enter your credentials once.
No, you can’t customise these Power BI reports. Siunie Sutjahjo, Principal Program Manager for CQD did talk about a Power BI Desktop Direct Query connector for CQD in her great ignite session Advanced Reporting and Diagnostics using Call Quality Dashboard (CQD). This would potentially allow you to create your own Power BI direct query reports from the CQD data.
That isn’t available yet, but I’ll have a blog post out as soon as it is. stay up to date on my email list.
A Microsoft MVP and Microsoft Certified Master, Tom Arbuthnot is Founder and Principal at Empowering.Cloud as well as a Solutions Director at Pure IP.
Tom stays up to date with industry developments and shares news and his opinions on his Tomtalks.blog, UC Today Microsoft Teams Podcast and email list. He is a regular speaker at events around the world.
This site uses Akismet to reduce spam. Learn how your comment data is processed.
Great post Tom.
Thanks Paula.
Look forward to your feedback on the reports
Very useful thanks Tom – hopefully MS will release a report for audio devices in the future
[…] https://tomtalks.blog/2020/02/6-power-bi-reports-for-microsoft-teams-call-quality-dashboard-cqd/ […]
[…] Tweeted by @tomarbuthnot https://twitter.com/tomarbuthnot/status/1224999918613471233Read More […]
Reports are fantastic! But the data shown between Wifi and Wired is the same. I’m getting always the same results between Wired and WiFi. Thank you,
Thanks. I will ask about this.
the link to download PBIX report pack downloads files with .pbit extension.
Biju,
You need to roll GitHub back to the March 18th file version to get the PBIX files. PBIT files have been created in a more up to date version of Power BI which is seemingly not available outside MS yet.
Good post, but could use a small update, files in the report pack linke are *.PBIT not *.PBIX, so cannot be loaded in the way it showed in the doc.
Thanks. Yes Microsoft change it. On my list to update thanks
Thanks, Please update how we can get .pbit to load, or from where we can get those .pbix templates.
Ran into the same question/problem with PBIT. These are templates and you have to import them (File, Import). Note I was able to import using Power BI Desktop.
Super amazing content
[…] 6 Power BI Reports for Microsoft Teams Call Quality … […]
[…] offers a set of Power BI template reports for Call Quality Dashboard, the download has just been updated to include Matt Wade’s great Quality of Experience Report […]
Session expired
Please log in again. The login page will open in a new tab. After logging in you can close it and return to this page.






![clip_image001[4] clip_image001[4]](https://149371380.v2.pressablecdn.com/wp-content/uploads/2020/02/clip_image0014_thumb.png)


Leave a Reply